


INTRODUCTION
Colorectal cancer (CRC) is the 4th most lethal cancer worldwide. In 2018 alone, it killed over 310,000 people [1].
Its high prevalence urges research and development of treatments for this nosology. Radiation therapy (RT) for CRC is important for symptom alleviation and local control of the disease. RT reduces the local recurrence rates and causes the tumor to shrink. However, a full clinical response is extremely rare. The key factor is the radioresistance of tumor cells. Although several markers have been suggested for use as chemotherapy and RT response predictors, none of them is in clinical use. Since CRC constitutes a heterogeneous group of diseases, a universal molecular predictive marker is hard to find. In vitro experiments using cell lines showed several genetic loci (XRCC3, XRCC2, FGFR4, and NF-KB) that could potentially determine the RT sensitivity; however, further research into tumor cell radioresistance is still needed [2, 3, 4].
The goal hereof was therefore to screen the CRC radioresistance predictors in a model experiment using data on the aberrant expression of genes regulating the signal cascades involved in DNA repair, cell cycle regulation, and apoptosis.
MATERIALS AND METHODS
The study used an HT-29 human cell culture. The COrDIS Sprint kit was used to genotype the cells to verify that they matched the genotype of this cell line and were not contaminated. Cells were cultured in sterile vials (RPMI-1640, 10% fetal bovine serum, 50 μg/ml of gentamicin) at 5% CO2, 95% humidity, and 37 °C in a CB-150 CO2 incubator [5].
For the model experiment, the cultures were irradiated five times every 24 hours using a Novalis TX linear accelerator (Varian, USA) at 5 and 7 Gy. A Somatom Definition AS Siemens tomograph was used for topometry [5].
Total cell count and the living/dead cell ratio were evaluated in a Goryaev chamber using a 0.4% trypan blue solution. After the 5th exposure, the cell line was removed from the substrate of the sterile vial using the Trypsin-Versene solution. Apoptosis stage-specific cell counts were found using a FACSCanto II (BD, USA) cell analyzer and an Annexin V-FITC Apoptosis Detection Kit [5].
The HT-29 cell culture was cleansed of the medium with Dulbecco’s phosphate-buffered saline and centrifugated; 900 μl of QIAzol (QIAGEN) was added to the sediment. Total RNA was further fractionated and purified using RNeasy Plus Universal Kits (QIAGEN) per the manufacturer’s protocol. Ready RNA preparations were treated with DNase I to remove traces of genomic DNA. RNasin was added to the finished RNA preparation until reaching a concentration of 1 U/μl.
The quality of the resulting RNA was tested by agarose gel electrophoresis in terms of rRNA 28S/18S brightness, see Fig. 1.
The concentration of the obtained RNA preparations was measured by a Qubit 2.0® fluorometer (Invitrogen, USA).
For cDNA buildup, the research team prepared a reaction mixture containing 5 μM of random primers, 1x RT buffer, 0.5 μM of dNTP mix, 0.5 U/μl of RNase Inhibitor (Thermo scientific), 5 U/μl of Reverse Transcriptase MMLV (Sintol, Russia), and the isolated RNA as the matrix. The resulting mix was incubated at 44 °C for over 1 hour; the reverse transcriptase was inactivated at 92 °C for over 10 minutes.
Real-time quantitative polymerase chain reaction (RT-qPCR) was performed to find the transcriptional activities of 32 genetic loci (ATM, AKT, BRCA1, BRCA2, BRIP, CDK1, CDKN1B, CCND1, CCND3, FGFR2, HIST1, H2AX, KU70, EXO1, PTEN, RAD50, RAP80, RNF168, TOPB1, RIF1TP53, MDM2, XRCC4, BAX, BCL2, CASP8, CASP3, CASP9, RBBP8, EP300, LIG4, C-FLIP). The stability of the reference genes was assessed by the geNorm algorithm. GAPDH, ACTB, and B2M were used as reference genes. Specific oligonucleotide primers were designed by means of NCBI GenBank and Primer-BLAST, see Table 1 for the primer sequence.
Each locus was set in three procedural repetitions. A reaction mixture (1x PCR buffer, 1.5 mM of MgCl2, 0.2 mM of dNTP, 500 nM of each primer, 0.05 U/μl of Taq-polymerase, and 10 ng of cDNA) was used for amplification. NTC and NRT samples were used for internal control. The resulting mixtures were amplified in a CFX thermocycler (Bio-Rad, USA) at 95 °C over 240 seconds; 40 cycles: 10 seconds at t = 95 °C, 30 seconds at 58 °C, and 30 seconds at 72°C.
The relative expression was calculated by the formula: RE=2-ΔΔCt.
The results were normalized by three reference genes (GAPDH, ACTB, and B2M) and by the expression of the corresponding target genes in the control group samples; see the procedure below.
1. Normalization by the geometric mean of the reference loci:
2. ΔC(t) = C(t)target – geometric meanC(t)reference.
3. The arithmetic mean ΔC(t) calculated for each gene for the control group (the intact group) and the exposed group.
4. Normalization by the control (intact) group:
5. ΔΔC(t) = arithmetic meanΔC(t)of the exposed group – arithmetic meanΔC(t) of the control group.
6. The final result (factor of difference): 2-ΔΔC(t).[6].
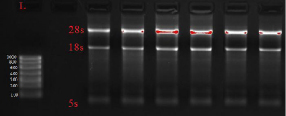
Fig. 1. Electrophoretic imaging of RNA isolated from freshly frozen rectal tumor tissue. Imaging performed with Gel Doc XR PLUS (BioRad, USA)
Table 1
Primer sequence for detecting relative gene expression
|
No. |
Gene |
5’→3’ primer sequences |
|
1 |
BRCA1 |
F: ACC TGT CTC CAC AAA GTG TGA |
|
R: ACA CTG TGA AGG CCC TTT CT |
||
|
2 |
BRCA2 |
F: AGT TGG CTG ATG GTG GAT GG |
|
R: GGA TCC ACA CCT GGA GTG TC |
||
|
3 |
PTEN |
F: GGC ACA AGA GGC CCT AGA TA |
|
R: CTT AGC GCC TCT GAC TGG G |
||
|
4 |
CASP3 |
F: CTG GAA TAT CCC TGG ACA ACA TT |
|
R: TCA ACA TCT GTA CCA GAC CGA |
||
|
5 |
CASP8 |
F: CTG AAG CAA ACA GCC AGT GG |
|
R: GAT CTC AAT TCT GAT CTG CTC AC |
||
|
6 |
GAPDH |
F: GTC AAG GCT GAG AAC GGG AA |
|
R: TCG CCC CAC TTG ATT TTG GA |
||
|
7 |
BAX |
F: GGG ACG AAC TGG ACA GTA ACA |
|
R: GCT GCC ACT CGG AAA AAG AC |
||
|
8 |
B2M |
F: AGA TGA GTA TGC CTG CCG TG |
|
R: CTA TGA TGC TGC TTA CAT GTC TC |
||
|
9 |
BCL2 |
F: GGA TCC AGG ATA ACG GAG GC |
|
R: GAA ATC AAA CAG AGG CCG CA |
||
|
10 |
CASP9 |
F: TGA GAC CCT GGA CGA CAT CT |
|
R: TCC CTT TCA CCG AAA CAG CA |
||
|
11 |
P53 |
F: TTG GAA CTC AAG GAT GCC CA |
|
R: CGG GAG GTA GAC TGA CCC T |
||
|
12 |
MDM2 |
F: TAG GAG ATT TGT TTG GCG TGC |
|
R: CCT GCT GAT TGA CTA CTA CCA A |
||
|
13 |
AKT1_V1 |
F: AGCTGGTGCATCAGAGGCTG |
|
R: TGTAGCCAATGAAGGTGCCA |
||
|
14 |
ATM |
F: TGCGTGGCTAACGGAGAAAA |
|
R: ATCACTGTCACTGCACTCGG |
||
|
15 |
BRIP1 |
F: TTACCCGTCACAGCTTGCTA |
|
R: CTCATCTGCTGGTTTCCCACT |
||
|
16 |
CDK1 |
F: AAGCCGGGATCTACCATACC |
|
R: CATGGCTACCACTTGACCTGT |
||
|
17 |
CDKN1B |
F: TAATTGGGGCTCCGGCTAAC |
|
R: GAAGAATCGTCGGTTGCAGGT |
||
|
18 |
CCND1 |
F: GATCAAGTGTGACCCGGACT |
|
R: CTTGGGGTCCATGTTCTGCT |
||
|
19 |
CCND3 |
F: GTGGAGACTGGCTCTGTTCG |
|
R: TCACATACCTCCTCGTCAGGT |
||
|
20 |
FGFR2 |
F: AACAGTCATCCTGTGCCGAA |
|
R: TGGACTCAGCCGAAACTGTTA |
||
|
21 |
KU70 |
F: ACGTAGAGGGCGTTGATTGG |
|
R: TGGCTACTGCTCACTTTGGC |
||
|
22 |
RAD50 |
F: GCGTGCGGAGTTTTGGAATAG |
|
R: TTGAGCAACCTTGGGATCGT |
||
|
23 |
RAP80 |
F: GAGTGAGCAGGAAGCTAGGG |
|
R: AGAAGGCCGGCAACTATTCA |
||
|
24 |
EXO1 |
F: GAACAAGCCGGGGTTACAGA |
|
R: AGGAGGAAGCTTTTCAGAATTTTT |
||
|
25 |
Rif1 |
F: GGCTGTTTCCATCGGTCACT |
|
R: CATACGACTGGTCAGAGTCAGG |
||
|
26 |
RNF168 |
F: GCCAGTTCGTCTGCTCAGTA |
|
R: CTGCCGCCACCTTGCTTAT |
||
|
27 |
HIST1 |
F: AAGAGCCTGGTAAGCAAGGG |
|
R: TGCACCCGTTGCCTTAGTTT |
||
|
28 |
TopBP1 |
F: CCAACGAGTTCAGAAATGTCCAG |
|
R: AACGCCACTAAAAGGGTCACA |
||
|
29 |
ACTB |
F: AACCGCGAGAAGATGACCC |
|
R: AGCACAGCCTGG TAGCAAC |
||
|
30 |
H2AX |
F: GGCCTCCCAGGAGTACTAAGA |
|
R: CTCTTTCCATGAGGGCGGTG |
||
|
31 |
XRCC4 |
F: TTGATCTGTGAAAGCGGGCG |
|
R: TCTCCATTTCTTAATACCTCTCCGT |
||
|
32 |
RBBP8 |
F: CGAGGATTTGGCACTCTGGT |
|
R: ACAGGTCAAATACCGCCTCC |
||
|
33 |
EP300 |
F: GCCCTCTACCTGACCCAAGT |
|
R: ATAGCCCATAGGCGGGTTG |
||
|
34 |
LIG4 |
F: GGCTTGACGTCAGGAAACCAT |
|
R: GAAGTTTGTGAGGCAGCCAT |
||
|
35 |
C-FLIP |
F: GTGACAGCTGAGACAACAAGG |
|
R: TGGGGGAGTTCGTCCTGT |
Note: F means ‘forward primer’, R means ‘reverse primer’.
Data was processed statistically by one-way ANOVA in Statistica 8.0 (StatSoft Inc.). Author-written R scripts (R-Studio 8.10.173.987) were used for hierarchical clustering by Euclidean distance as well as for heat mapping. Edwards–Venn diagrams were plotted by an algorithm comparing multiple sets, which had been implemented in JavaScript. Gene clustering by function was performed using functional module detection (FMD). The Q value for each term linked to the functional modules was calculated using one-sided Fisher’s exact test with Benjamini and Hochberg adjustment [7].
RESULTS
Ionizing radiation causes double-stranded DNA breaks in tumor cells; however, some tumor cell clones are able to boost the repair of such ruptures to overcome the cytotoxic effects of radiation; they can also boost other signaling pathways that are not part of the cell repair system [8].
In this model experiment, only one HT-29 cell pool remained viable. Thirty-two percent of cells remained viable after 5-Gy exposure, 20% did after 7-Gy exposure. This could be due to such cells’ increased radioresistance resulting from specific molecular and genetic features. Irradiation of HT-29 cells returned the differential expression values of 32 genes in intact (control) and exposed cells, see Fig. 2.
Three main gene clusters were identified by the peculiarities of expression in intact and irradiated samples: 1 – BRCA2, C-FLIP, CASP3, XRCC4, KU70, CDK1, 2 – AKT, RBBP8, RAP80, EP300, BCL2, RAD50, FGFR2, H2AX, CCND3, CCND1, and 3 – TOPB1, ATM, RNF168 PTEN, BRIP, EXO1, BAX, TP53, CASP9, RIF1, CASP8, BRCA1, CDKN1B, HIST1, LIG4.
The intact and irradiated cell groups can be clustered by the identity of gene expression, see Figures 2 and 3. Some genes of intact and irradiated cells are similar expression-wise at different clustering levels, see Figures 2 and 3, Table 2; this could be due to the fact the HT-29 line initially contained clones in which these genes reached a certain level of expression and thus enabled the selective survival of such clones.
Notably, four genes (BRCA2, CASP9, H2AX, RBBP8) had elevated expression in more than five of the tested groups; BRCA2 expression was increased even in some intact cells, see Table 2.
Normalizing the relative expression in cells exposed to 5-Gy and 7-Gy radiation returned the following results: RBBP8 expression increased by a factor of 1.7 and 2.2, BRCA2 expression increased by a factor of 1.7 and 2.3, H2AX expression increased by a factor of 2.3 and 4.5, and CASP9 expression increased by a factor 2.0 and 2.4, whilst BCL2 decreased by a factor of 1.6 and 3.0 significantly at p<0.05 compared to cells. Cells exposed to 7 Gy of radiation also had a statistically significant increase in RIF1 expression by a factor of 1.5 (p<0.05), see Fig. 4.
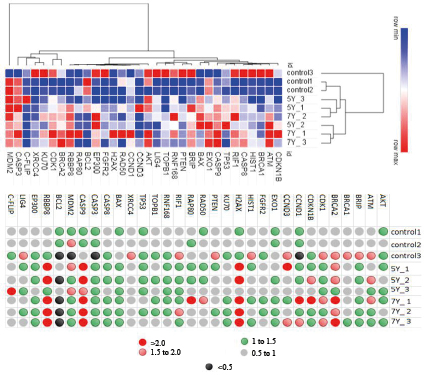
Fig. 2. Heatmap and cluster analysis of the differential expression of 32 genes in intact (control) and exposed HT-29 cells
Table 2
Similarities and differences between clusters in terms of gene expression
|
Gene |
No. of higher-expression groups |
Group name |
|
BRCA2 |
6 |
control3, 5Y_1, 5Y_2, 7Y_1, 7Y_2, 7Y_3 |
|
CASP9 |
6 |
5Y_1, 5Y_2, 5Y_3, 7Y_1, 7Y_2, 7Y_3 |
|
H2AX |
5 |
5Y_1, 5Y_2, 7Y_1, 7Y_2, 7Y_3 |
|
RBBP8 |
5 |
5Y_1, 5Y_2, 7Y_1, 7Y_2, 7Y_3 |
|
ATM |
3 |
control3, 5Y_2, 7Y_1 |
|
CCND3 |
3 |
control3, 5Y_1, 7Y_3 |
|
CDK1 |
3 |
control3, 7Y_1, 7Y_3 |
|
MDM2 |
3 |
control2, 5Y_1, 5Y_3 |
|
CCND1 |
2 |
7Y_1, 7Y_3 |
|
CDKN1B |
2 |
5Y_2, 7Y_2 |
|
RIF1 |
2 |
control3, 7Y_2 |
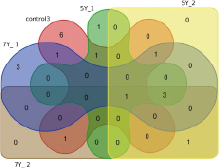
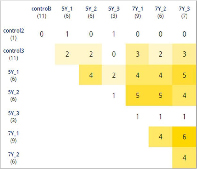
Fig. 3. Edwards-Venn diagram: similar numbers of high-expression genes in nine groups: three control groups, three 5-Gy groups, and three 7-Gy groups
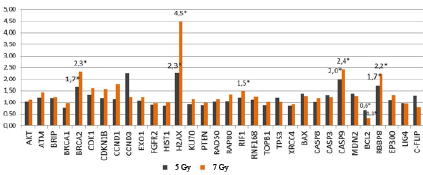
Fig. 4. Relative expression of genes in radioresistant HT-29 cells after 5-day exposure to 5-Gy and 7-Gy radiation * statistically significant differences from the intact (control) cells (p<0.05)
The FMD algorithm was applied to the tested genes (ATM, AKT, BRCA1, BRCA2, BRIP, CDK1, CDKN1B, CCND1, CCND3, FGFR2, HIST1, H2AX, KU70, EXO1, PTEN, RAD50, RAP80, RNF168, TOPB1, RIF1TP53, MDM2, XRCC4, BAX, BCL2, CASP8, CASP3, CASP9, cRBBP8, EP300, LIG4, C-FLIP) and split them into six functional modules, see Fig. 5 for visualization.
As shown in Fig. 5, a change in the expression of BRCA2, CASP9, and RIF1 affects three functional modules in a group of signaling cell cascades: apoptosis regulation (M6, Q=0.0001), cellular response to irradiation (M4, Q<1e-4), and DNA repair (M1, Q<1e-4).
Multiple association network integration identified the interactions between the following genes: BCL2, BRCA2, H2AX, CASP9, RBBP8, RIF1, and APAF1 (apoptotic peptidase activating factor 1), SPO11 (initiator of meiotic double stranded breaks), PALB2 (partner and localizer of BRCA2), APPL1 (adaptor protein, phosphotyrosine interacting with PH domain and leucine zipper 1), PSIP1 (PC4 and SFRS1 interacting protein 1), DIABLO (diablo IAP-binding mitochondrial protein), DMC1 (DNA meiotic recombinase 1) BIK, (BCL2 interacting killer), BAZ1B (bromodomain adjacent to the zinc finger domain 1B), FKBP8 (FK506 binding protein 8), BAG1 (BCL2-associated athanogene 1), RAD51, VDAC1 (voltage-dependent anion channel 1), XRCC3 (X-ray repair cross complementing 3), DCC (DCC netrin 1 receptor) RAD50 (RAD50 double-strand break repair protein), PSMC3IP (PSMC3 interacting protein), TEX15 (testis expressed 15), MND1 (meiotic nuclear divisions 1), and AIFM1 (apoptosis inducing factor, mitochondria associated 1), see Fig. 6. The algorithm predicts the function of a gene in a complex multigene network by applying a machine learning method based on the Gaussian field label distribution. The algorithm assigns the computed association strength to each node in the constructed network [9]. Thus, BRCA2, H2AX, BCL2, CASP9, and RBBP8 are components of different signaling pathways in tumor cells; changing their transcriptional activity will modulate the activity of multiple other genes, see Fig. 6.
As ionizing radiation causes a double-stranded DNA break, H2AX (a histone protein coded by the H2AX gene) becomes serine-phosphorylated (γH2AX). This de-condenses the DNA and frees up space for the attachment of protein complexes such as MRN (Mre11, Rad50, and Nbs1), RAD51, and ATM that are necessary for DNA repair [10, 11].
The BRCA2-encoded protein is also necessary for post-exposure DNA repair as it interfaces directly with recombinase RAD51, thus stimulating an important stage of homologous recombination [12]. RBBP8 encodes a protein that regulates cell proliferation [13]. Accordingly, increased BRCA2, H2A, and RBBP8 expression in some of the HT-29 clones likely made DNA repair more efficient, which gave these cells an advantage and enabled them to survive radiation.
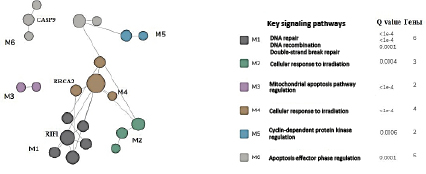
Fig. 5. Functional classification of the signaling pathways including 32 genetic loci
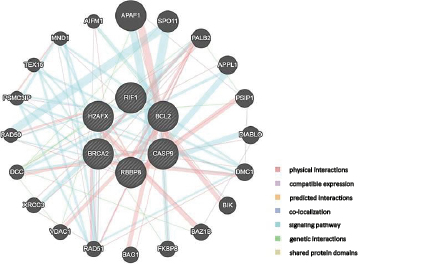
Fig. 6. Gene interactions computed by the multiple association network integration algorithm
BCL2 and CASP9 are two proteins important for the regulation of apoptosis. BCL2 suppresses apoptosis by altering the permeability of the mitochondrial membrane, which prevents the release of cytochrome C from mitochondria and inhibits caspases (inhibition is also implemented by binding APAF1, an apoptosis-activating factor). On the contrary, caspase-9 is a critical apoptosis-initiating protein that APAF1 activates by splicing pro-caspase-9 [14]. Accordingly, an increased CASP9 expression coupled with reduced BCL2 expression may lead to more efficient apoptosis compared to intact cells. It can be assumed this trait may somewhat regulate the population of HT-29 clones that have these molecular and genetic features.
CONCLUSIONS
Thus, this study has identified the original heterogeneity of HT-29 cells in terms of the transcriptional activity of some repair- and apoptosis-regulating genes. This heterogeneity is fundamental to the selective cell survival past 5-Gy and 7-Gy irradiation: the survivors had a more efficient DNA repair system with a higher transcriptional activity of BRCA2, H2AX, and RBBP8, and a more efficient apoptosis regulation system with a more transcription-active proapoptotic CASP9 gene and a less transcription-active anti-apoptotic BCL2 gene.
FINANCIAL SUPPORT AND SPONSORSHIP
The research was carried out as part of the Government Contract: Search for Rectal Cancer Radioresistance Predictors and Development of Personified Neoadjuvant Therapeutic Approaches
CONFLICTS OF INTEREST The authors declare no conflict of interest